
FIELD NOTES / Percentages
Combine percentages with the right weights
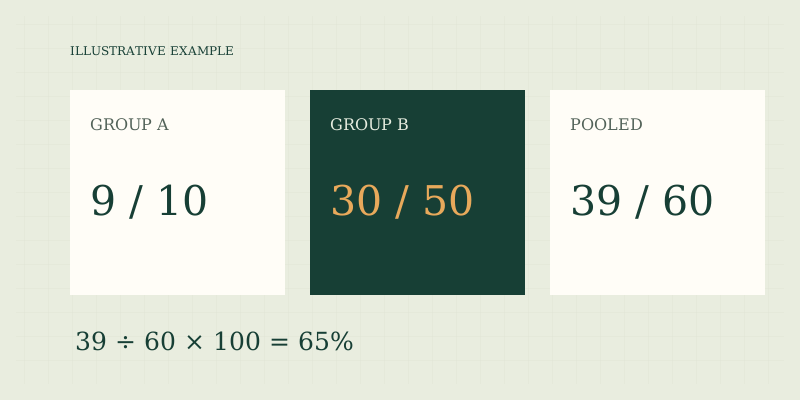
To combine percentages for groups of different sizes, add their underlying parts and divide by the combined whole. A simple average of displayed percentages gives each group equal weight, which usually does not represent the share across all items or people. Retain the original counts whenever possible.
Start with the counts
In an illustrative exercise, one class has 9 completed assignments out of 10, while another has 30 out of 50. Their completion rates are 90% and 60%. Across both classes, 39 assignments are completed out of 60. The combined rate is 39 ÷ 60 × 100 = 65%.
| Illustrative group | Completed | Assigned | Completion rate |
|---|---|---|---|
| Class A | 9 | 10 | 90% |
| Class B | 30 | 50 | 60% |
| Combined | 39 | 60 | 65% |
A simple average of 90% and 60% is 75%. That answers the question “what is the equally weighted mean of the two class rates?” It does not answer “what share of all assigned work was completed?” The question determines the appropriate weighting.
Use weights when only rates are available
If a rate p is expressed in percent and its group size is n, the corresponding part is n × p ÷ 100. Combining groups produces the formula (n1 × p1 + n2 × p2) ÷ (n1 + n2), which directly returns a percentage when p1 and p2 are percentage numbers. For the example, (10 × 90 + 50 × 60) ÷ 60 = 65. The larger class receives more weight because it contributes more assignments. If the percentages were rounded before publication, the reconstructed parts may not be whole numbers. Those are estimates, not recovered exact counts. Ask for original counts before treating the combined rate as exact.
Know what the weights represent
Weights can be counts, dollars, credit hours, exposure time, or deliberately assigned importance. They are not interchangeable. A course grade may give a project 40% of the grade and a quiz 10% regardless of how many questions each contains. That is a policy-defined weighting scheme, rather than a pooled question-level success rate. For an illustrative grade with two components, a score of 80 weighted at 25% and a score of 90 weighted at 75% produces 80 × 0.25 + 90 × 0.75 = 87.5. The weights sum to 100%. If your syllabus uses category weights, missing assignments, dropped scores, or extra credit, follow those rules instead of assuming this two-component model applies.
Check that the groups can be combined
Pooled shares require compatible definitions. Do not combine one group's “completed on time” with another group's “completed eventually” without explaining the mismatch. If the same person appears in two groups, adding headcounts may double-count them. If the groups describe different time periods, decide whether the desired result is a pooled total, a time average, or a period comparison. A combined rate can also conceal meaningful differences. The overall 65% in the example does not describe either class's experience. Report group sizes and rates alongside the pooled result when a reader needs to understand variation. Aggregation is a summary choice, not proof that all groups behave alike.
Sanity-check the answer
With nonnegative weights, a weighted average of rates lies between the smallest and largest input rates. A combined answer of 95% from only 60% and 90% inputs indicates an error unless the calculation uses a different definition. If the largest group has the lowest rate, expect the combined answer to be closer to that lower rate. A group with zero weight contributes nothing to the weighted sum. If every group has zero weight, the denominator is zero and no weighted average exists. Negative weights can appear in specialized mathematics, but they do not represent ordinary group sizes. For household, classroom, and basic reporting tasks, investigate a negative count rather than silently accepting it.
A worksheet for pooled percentages
- Define the event or part that every group counts.
- Record each group's numerator and denominator.
- Check for overlap and inconsistent periods.
- Sum the numerators separately from the denominators.
- Divide the total part by the total whole and multiply by 100.
- Keep group-level information available for interpretation.
Use share mode in the percentage calculator after summing counts: enter 39 as the part and 60 as the whole. For the foundational distinction, see percentage basics. Read percentage points to compare group rates and rounding percentages before reconstructing counts from published rates.
Preserve the question
Label a pooled result as a share of all items, and label an equal-group mean as an average of group rates. The wording records which weighting you intended.
FAQ
When is a simple average of percentages valid?
It is appropriate when equal weight per group is the intended statistic, or when all relevant denominators are equal and definitions match. State that intention rather than assuming it.
Can I combine rates without group sizes?
You cannot generally determine the pooled rate uniquely. Different group sizes can produce different pooled answers from the same displayed percentages. Obtain the denominators or report the group rates separately.
Should percentages always add to 100%?
Only for mutually exclusive categories that exhaust the same whole, subject to rounding. Overlapping categories, multiple-response questions, or incomplete categories need not total 100%.
Sources
- Sources and methods — formulas are elementary weighted arithmetic; classroom values are illustrative.
- Bureau of Labor Statistics: calculating percent changes — related guidance on keeping comparison bases consistent.
Put the method to work.
Open calculator ↗